Inspect JVM running in Kubernetes with VisualVM
Often times, you will run into obscure errors that require you to take a peek under the JVM hood, which in itself can be a daunting task. In this tutorial, we will take a look on how to troubleshoot a running application in a Kubernetes cluster with VisualVM as well as how to inspect Heap Dumps and how to pass them from the container to our machine.
For this example, we have a Hello Spring Boot Application (the code can be found here) that saves a timestamp of each request in memory (in order to provide us some interesting data for us to analyze later on). We will be working hands on with VisualVM so make sure to download it and start it up, it is very straightforward and here is the link. One could also use JConsole for such a task but let’s leave that for some other time.
We use this slim JRE11 Docker image and expose an additional port as we will need to make a JMX connection to the JVM
FROM openjdk:11.0.2-jre-stretch

COPY target/demo*.jar /opt/app.jar
EXPOSE 8080 9010

ENTRYPOINT exec java $JAVA_OPTS -jar /opt/app.jar
We will use a standard K8s deployment file in order to deploy this to the cluster (minikube is fine). Notice that we have defined hard limits on the container (request == limits) so we can limit the amount of memory being used and cause some interesting behavour.
---
apiVersion: apps/v1
kind: Deployment
metadata:
  name: demo-app
  labels:
    app: demo-app
spec:
  selector:
    matchLabels:
      app: demo-app
  template:
    metadata:
      labels:
        app: demo-app
    spec:
      containers:
        - name: demo-app
          image: uroshtrifunovic/spring-boot-demo:jvm-k8s
          imagePullPolicy: Always
          ports:
            - containerPort: 8080
          resources:
            requests:
              memory: 128Mi
              cpu: 100m
            limits:
              memory: 128Mi
              cpu: 100m
          env:
            - name: JAVA_OPTS
              value: "-Dcom.sun.management.jmxremote \
                      -Dcom.sun.management.jmxremote.authenticate=false \
                      -Dcom.sun.management.jmxremote.ssl=false \
                      -Dcom.sun.management.jmxremote.local.only=false \
                      -Dcom.sun.management.jmxremote.port=9010 \
                      -Dcom.sun.management.jmxremote.rmi.port=9010 \
                      -Djava.rmi.server.hostname=127.0.0.1"
Also notice all the JVM arguments we have defined in order to be able to connect remotely via JMX. Let’s go through them one by one and see what they do:
-Dcom.sun.management.jmxremote- enable JMX connections-Dcom.sun.management.jmxremote.authenticate=false- disable auth-Dcom.sun.management.jmxremote.ssl=false- self-explanatory-Dcom.sun.management.jmxremote.local.only=false- the same 🙂
These last 3 arguments are needed for k8s port-forward to work:
-Dcom.sun.management.jmxremote.port=9010-Dcom.sun.management.jmxremote.rmi.port=9010-Djava.rmi.server.hostname=127.0.0.1″
We deploy our application into the cluster and will do a kubectl port-forward in order to open a port and connect through it via JMX as we don’t want to expose our JMX to the world, just ourselves or if this was PROD – then we could have used a secure connection, with IP whitelisting with all the bells and whistles. For the sake of simplicity – kubectl port-forward FTW to port 9010!
At this point, we can start our VisualVM. We should see our application running in the “Local” section and connect, like so:
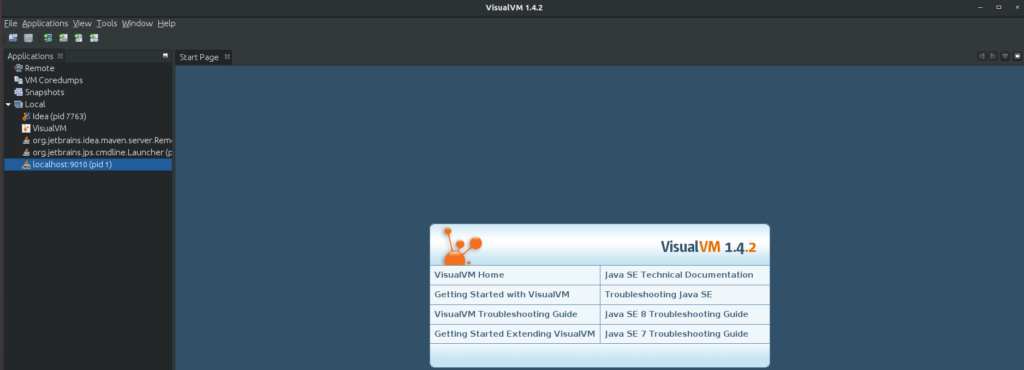
We are greeted with an overview of our JVM, flags, arguments and other semi-useful information. If you switch to the “Montor” tab, you will notice graphs for Threads, CPU, classes and Heap. See those nice spikes in the Heap? That’s our friend, the Garbage Collector doing it’s work for us.

Now, let’s start using our application and drive some traffic through it. I will just keep calling the /hello endpoint and monitor the behaviour in VisualVM (note that your URL will be different from mine, here I am using minikube).
$ while true; do curl "http://172.17.0.2:32245/hello"; echo "\r"; done
The following is what we can see in our monitoring tool:
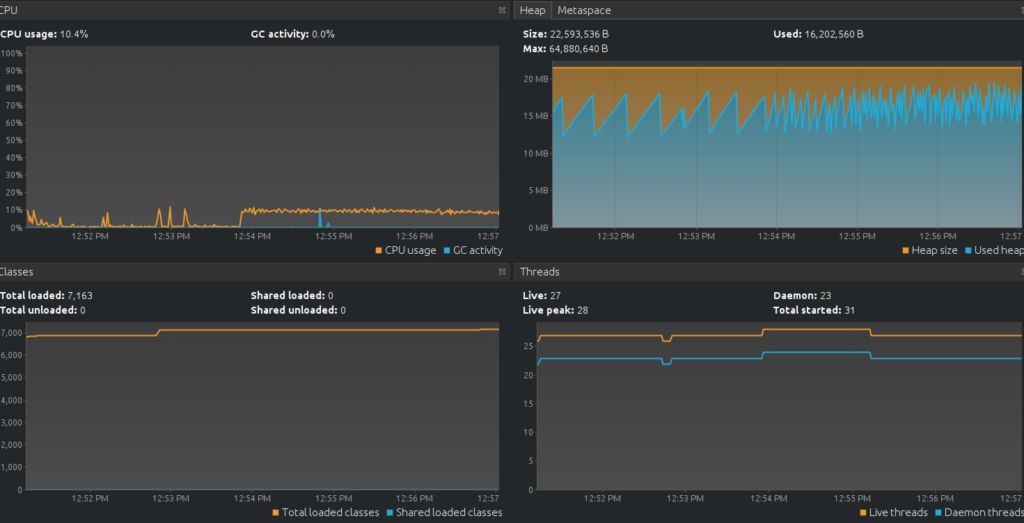
Now we are actually getting some CPU usage and we see that the GC is also working more often.
You can use this technique to troubleshoot issues like OOM errors or whenever you want to see how busy or idle are your threads.
That’s all folks!
Keep on hacking!