Remote Debug a Spring Boot Application Running in Kubernetes
There will be times when debugging on your local machine just won’t do it due to configs, environments, etc… In that case, wouldn’t it be great you can actually remote debug your Spring Boot app running in your Kubernetes cluster? In this tutorial, we’ll take a look at a pretty straightforward way in debugging Spring applications on Kubernetes. There are certain times when you want to do this, as you might have an integrated K8s setup, with ConfigMaps, Secrets and other services.
Write a simple Spring Boot application
Here you can see the example application we are using, which is a simple Spring Boot starter with only a web dependency. I’ve crammed a @RestController in the main class for brevity but you should not do this at home (nor production).

After we have written our very complex controller – Next thing we will do is to create a run configuration. We do this by clicking the “Edit run configuration” in our IDE (I am using IntelliJ IDEA but this is almost the same in Eclipse or other IDEs) and select a “Remote” configuration.

We name the configuration, for example, k8s-remote-debug. Next, select the host and the port where the application is accessible. In the example, this is localhost:5005. As you can see, the IDE actually provides us with the argument we need to pass to the JVM that is running the application in order to enable the remote connection. Important thing to note here is that for attaching to the container and the application, we will use a port-forward but depending on where your Kubernetes pod is deployed, you can also use an ingress endpoint and expose it, even though it is not recommended exposing your applications sensitive endpoints like that.
-agentlib:jdwp=transport=dt_socket,server=y,suspend=n,address=5005
Let’s go over these arguments, one by one in order to understand what’s actually going on:
transport=dt_socket– use a socket to connect to the JVM.server=y– specifies that this VM will act as a server for the debugging, and the debugger itself would have to connect to it as a client.suspend=n– default value is “y”, which means that the virtual machine would be suspended before it loads the main class, then the attached debugger would resume the execution of the JVM. Our value is set to “n”, because we want the application to boot. However, if you need to debug some startup code, leave “y”.address– host and port of the JVM, in our example, only port number is displayed, as we running on localhost. In Java versions higher than 9, the syntax is a bit different, there is an * in front of the port (e.g address=:*5005).
Next up is our Dockerfile, that can be something like this:
FROM openjdk:11.0.2-jre-stretch

COPY target/demo*.jar /opt/app.jar
EXPOSE 8080 5005

ENTRYPOINT exec java $JAVA_OPTS -jar /opt/app.jar
Notice that we are exposing 2 ports here:
- 8080 – a default web app port
- 5005 – port used for debugging
And also notice the $JAVA_OPTS variable. This is where we will add our JVM arguments, but we will do so in the Kubernetes deployment file, in order to have better flexibility and be able to change this on the go.
Write a Kubernetes deployment file
Our deployment file might look like something like this:
---
apiVersion: apps/v1
kind: Deployment
metadata:
  name: demo-app
  labels:
    app: demo-app
spec:
  selector:
    matchLabels:
      app: demo-app
  template:
    metadata:
      labels:
        app: demo-app
    spec:
      containers:
        - name: demo-app
          image: uroshtrifunovic/spring-boot-demo:remote-k8s-debug
          imagePullPolicy: Never
          ports:
            - containerPort: 8080
          env:
            - name: JAVA_OPTS
              value: "-agentlib:jdwp=transport=dt_socket,server=y,suspend=n,address=5005"
So, nothing new here, just your every day K8s Deployment yaml. We have both ports exposed and also our environment variable set. Likewise, a Service would look something like this:
---
apiVersion: v1
kind: Service
metadata:
  name: demo-app
  labels:
    app: demo-app
spec:
  type: LoadBalancer
  selector:
    app: demo-app
  ports:
    - port: 80
      targetPort: 8080
Nothing special here, just mapping port 80 to 8080, so we don’t have to deal with ports when we are calling the service.
Next step explains how to build the Docker image but the image is already built and uploaded to Dockerhub, so you can omit it and have K8s pull it from there if you prefer, just make sure to remove line with imagePullPolicy: Never from your deployment.yaml as this will force the use of local Docker images from your machine.
We compile our code in a jar with mvn clean package (or install, whatever makes you tick) and build our Docker image by executing this from the project root:
$ docker build -t uroshtrifunovic/spring-boot-demo:remote-k8s-debug .
Deploy the Spring Boot app in the Kubernetes cluster
Now, all that is left is to deploy. Before that, please make sure you are deploying this to the correct k8s cluster 🙂
I will use my local Minikube for this purpose.
$ kubectl config use-context minikube
# We have put our both yaml files in a 'k8s' directory
$ kubectl apply -f k8s/
Note - If you are using Minikube and are following the tutorial like described, there is a possibility that you will run into an error: ErrImageNeverPull because your cluster cannot reuse the Docker daemon to get the local image. In such case, you can enable it with eval $(minikube docker-env) command and restarting the pod. It is described in the Minikube Readme file.
If our deployment has been deployed correctly and our pod is running, we can go ahead and get the URL from Minikube, like so:
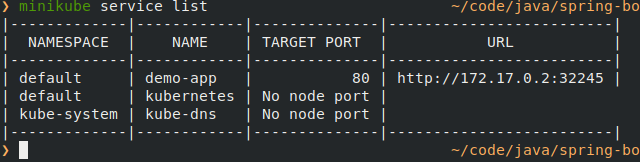
For exposing the other port, I will run a port-forward command, like so:
$ kubectl port-forward demo-app-579cb486f4-qb2g9 5005
Remote debug the Spring Boot application
At this point, we run our app from our IDE in “Debug” mode and set a breakpoint on the logging statement (line 23 in the example). We should see no errors, only a message that we are “Connected to the target VM, address: ‘localhost:5005’, transport: ‘socket”‘
Next we call the endpoint:
$ curl http://172.17.0.2:32245/hello
At this point, your IDE should display something like this, meaning that we are now actually debugging the code that is inside the Kubernetes pod:

Word of caution for health probes
If you are using Spring Actuator with readinessProbe, livelinessProbe or startupProbe, your pod will fail to respond to those pings from the probes and eventually, it will get restarted. That being said, you can’t just go and run this in production. If you really want to, then you will have to either provide some very long timeout and/or threshold values for the probes or disable them altogether.
This is all you need to know about how to remote debug a Spring Boot application in Kubernetes. Congrats for making it this far, make a little dance to celebrate and go apply your newly learned skill somewhere useful 🙂
You can find all the code for the examples here.
Keep on hacking!